.svg)


🔥 What's New ?
👉 BigQuery: contribution analysis now available to all
For marketers, understanding what really influences business KPIs is crucial. Take the example of a hotel chain that sees an increase in its average basket: is this due to a change in clientele, the performance of a particular establishment, or the growing popularity of certain room categories? It's exactly to answer these questions that BigQuery has launched its new contribution analysis model, now available to all users.
This powerful analysis enables us to precisely identify the factors driving metric changes, by comparing two periods or segments of data. The model uses a test dataset and a control dataset to isolate the true impacts.
In concrete terms, this contribution analysis model uses machine learning and natural language processing, what we call "augmented analytics".augmented analytics" to detect data segments that show significant changes in a metric, by systematically comparing the data to be analyzed with a repository.
In our fictitious example of a French hotel chain, this analysis enables us to study the evolution of the average basket between Q4 2024 and Q1 2025, identifying precisely which dimensions (room type, location, number of guests) have contributed most to this evolution.
Let's analyze the data from the imaginary contribution analysis (please note that the figures are fictitious):
Overall, there was a 12.5% improvement (difference of 150) between the test and control groups.
Key factors to remember :
- Bookings for 2 participants: +30.8% (difference of 200), outperformance of 26.2%.
- Pool view suites: Best growth with +36.4% (difference of 200)
- Aix-en-Provence: +19.5% (difference of 160)
- Hôtel "Les Lavandes Roses ": +12.2% (difference of 120), close to the average
So what we can learn from this analysis is that we need to prioritize actions on reservations for two people and pool-view suites, which show the greatest potential.
ℹ️ To find out more, visit Analysis of contributions
👉 At Starfox Analytics, we're convinced that this new analysis is a real game-changer for businesses! By precisely identifying the factors that most impact business KPIs, it can optimize investments and significantly increase ROI. However, as with data-driven attribution models or other marketing mix solutions, Google remains discreet about how the contribution model is constructed and on what basis it is made... We look forward to testing it to assess its full potential!
👉 Google Cloud Next 2025: A recap of what's happened
Google Cloud Next is Google's "Event of The Year", an event held every year, mainly in April, where Google presents its new products, much like Apple's Keynote.
The event features various sessions, workshops and keynotes, led by Google teams, covering the full range of Google Cloud products.
Unsurprisingly, AI was at the heart of this year's event, with many major announcements including :
- +TPUs Ironwood: The 7th generation of Google TPUs, 10x more powerful than its predecessor.
- AI Agents: Available via Google Agentspace for all employees of companies with Gemini in Google workspace to search, synthesize and interact with data.
- Gemini 2.5 Pro: Preview on Vertex AI and the Gemini app.
- Gemini 2.5 Flash: Latency- and cost-optimized version, coming soon to Vertex AI and AI Studio.
- Lyria: The first enterprise-ready text-to-music model that generates 30-second clips.
- Customer engagement suite: next-generation CRM solution for creating multi-channel agents.
- A2A protocol: Enables communication between AI agents, regardless of their technology.
- ADK: Open-source framework for creating AI agents in less than 100 lines of code.
- Gemini for Google Workspace: New AI features in Docs, Sheets and Meet.
ℹ️ A number of sessions on all aspects of data analysis took place, including BigQuery, BigTable, Firestore, etc. To find replays of the sessions, go to Google Cloud.
💡 We believe that BigQuery is a major asset for analyzing user behavior with GA4 data. Our priority with these new transfers: to verify data consistency between BigQuery and the GA4 interface, while maintaining the level of detail needed to generate value.
👉 AI agents in BigQuery: A transformation in the way data pipelines are managed.
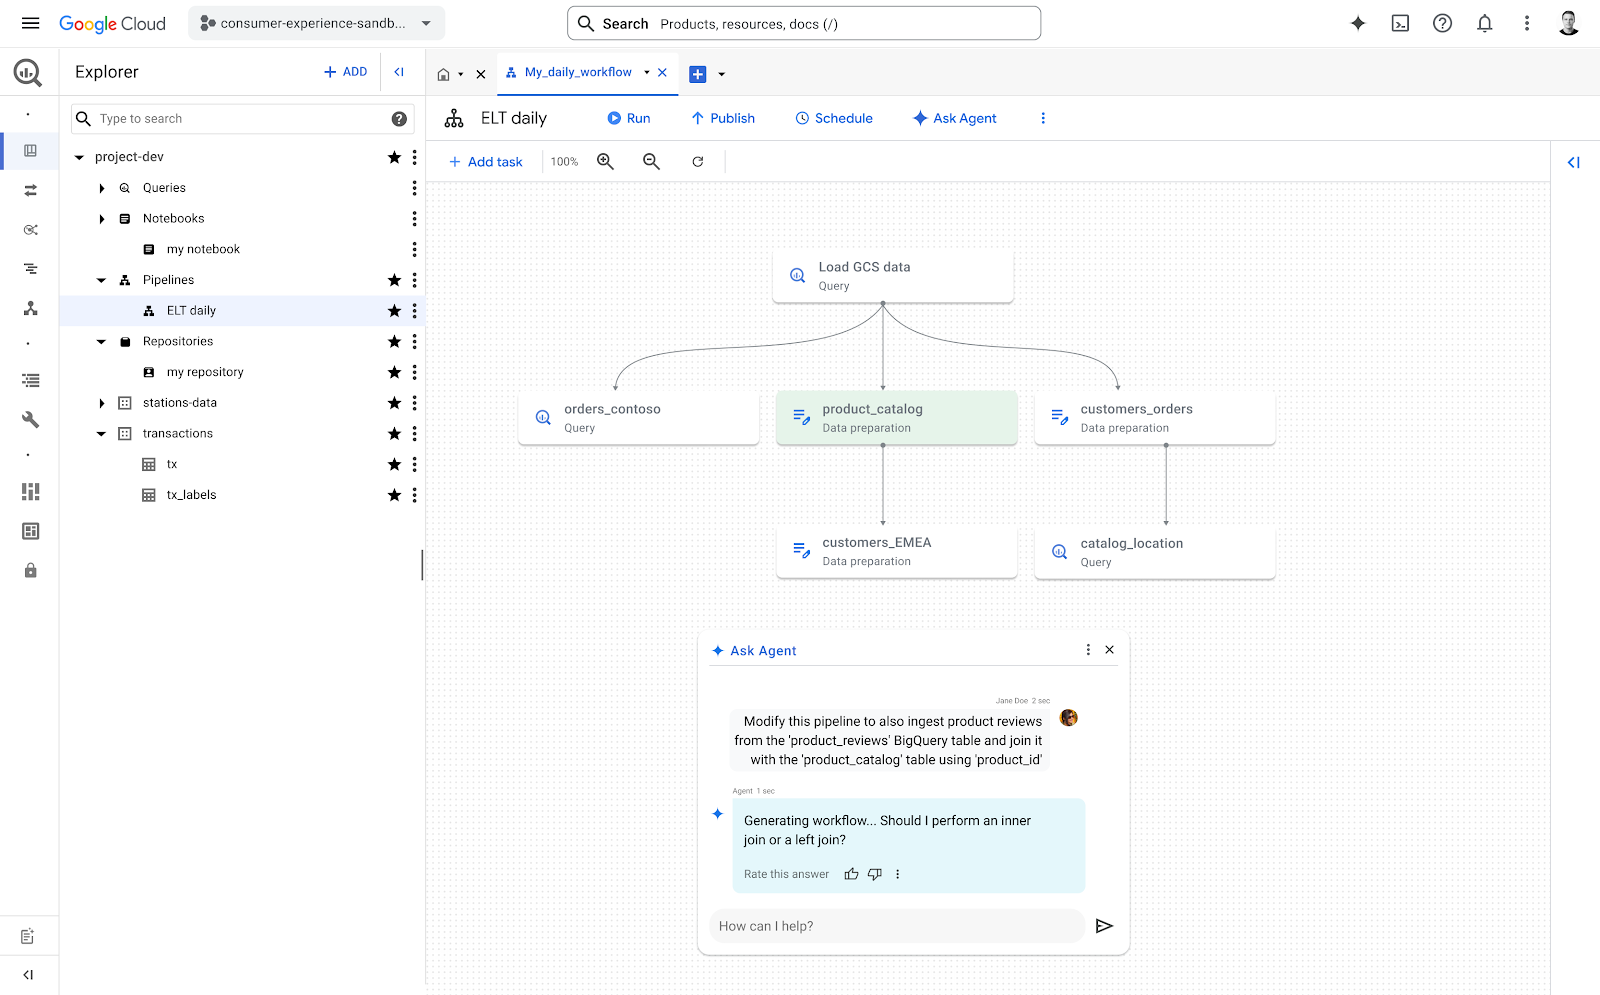
During a demo at Google Cloud Next 25, the BigQuery teams presented a new feature that could change the way we create and manage data pipelines, and it obviously involves AI integration: AI agents in BigQuery.
Still in the experimental stage, these agents rely on AI to make the creation and management of pipelines much simpler and faster.
In concrete terms, these agents are capable of analyzing the way pipelines are built in an organization, learning their models, and using them to create new ones or adapt existing ones. In short, these agents are capable of performing standard data preparation tasks
During a demonstration led by Terren Yim (BigQuery), several features were highlighted:
- Create a pipeline simply in natural language: simply describe what you want to achieve and the agent will build the appropriate pipeline. For example, you can ask the agent to integrate data from one table into another, mentioning the join key. The agent analyzes the existing code, proposes modifications, and even highlights potential impacts on downstream processes.
- Intelligent data preparation: automatic white space cleaning, normalization and standardization of values... without having to specify everything by hand.
- Contextually modify a pipeline: add a join, cut out text... everything is done conversationally.
- Work on a grand scale: several hundred pipelines can be created or modified at once via CLI or API.
The real potential of these agents is to save time, as they have the ability to analyze an existing pipeline to extract reproducible patterns. This will enable teams to save precious time, by rapidly creating new pipelines aligned with internal standards.
ℹ️ Watch the demo: Automate data pipelines with AI agents in BigQuery
💡 This evolution could scare off data professionals who fear being replaced by these AI agents. At Starfox Analytics, we are convinced that AI will not replace humans, rather it will be a tool to optimize our time, improve our efficiency and allow us to focus on high value-added activities, both for productivity in business and for our lives in society.
In the case above, the AI Agents in BigQuery will help us save time in the most tedious part of data handling: cleaning, standardization and documentation.
This will give data engineers time to exploit other data typologies and work on more innovative subjects, and data analysts the possibility of analyzing patterns, understanding behavior, making more advanced analyses, etc.
👉 Google Search Console: Access to hourly data for the last 10 days now available via API
While the Google Search Console interface only displays hourly data for the last 24 hours, the API provides access to hour-by-hour data for up to 10 days.
Developers or data engineers can thus create solutions that not only show hourly data for the current day, but also draw comparisons with the same day of the previous week, facilitating analysis of weekly trends.
ℹ️ Find out more about the Search Analytics API, which now supports hourly data
💡 At Starfox Analytics, we've developed pipelines for our media customers that extract hourly data from Search Console and store it in BigQuery. This data is particularly valuable, as it enables our customers to quickly assess the performance of their articles, especially on Google Discover where the impact is almost instantaneous. This solution gives them a level of responsiveness they didn't have before.
👉 GA4: Better paid attribution on Google Ads and new templates on snapshot reports.
Aggregated identifiers for better attribution of Google Ads traffic:
On GA4, when GCLID cannot be used to identify traffic sources (e.g. when users refuse consent ad_user_data), traffic is attributed to organic sources. From now on, Google will start using aggregated identifiers to attribute paid traffic to different sources. This enhancement enables more accurate attribution of Google Ads traffic, with system annotations to signal any significant changes.
New templates in snapshot reports :
Snapshot reports on GA4 now feature new predefined templates (User Behavior, Sales & Revenue, and Marketing Performance), enabling users to quickly get an overview of their data.

ℹ️ Find out more about Google Analytics
💡 Tip of the month
Our "Tip of the month" section shares practical tips used daily at Starfox Analytics. These tips cover various Web Analytics tools to optimize your work. Don't hesitate to try them out and share them with your colleagues.
👉 Cached query results in BigQuery
Every time BigQuery executes a query, it attempts to cache the result (there are certain limitations). If exactly the same query is executed while the cache is still available (the typical cache lifetime is 24 hours) - BigQuery will retrieve the data from the cache and avoid re-billing for data processing (of course, only if the underlying data hasn't changed between calls).
So, in short, as long as the data doesn't change and the query is exactly the same, you only need to pay for the first execution. And best of all, you don't have to do anything to make it work, because it's the default behavior.
💡 Think about partitioning and clustering your tables to optimize your queries and control your BigQuery costs. Caching is a default means of optimization, but partitioning, clustering, and any query optimization remain the main levers for controlling BigQuery costs.
📖 Sharing Is Caring
Every month, our "Sharing is Caring" column presents an in-depth article on a current topic in Web Analytics. Our experts use their know-how and online resources to explore these topics in detail.
This month, read Oussama's article on how to implement Matomo as a server side on GTM.
Deploying Matomo with GTM server-Side
❤️ Best resources and articles of the moment
- A nugget of open source solutions from google marketing solutions, with code, documentation, everything you need on Github!
- A great article on using Google Colab and Gemini to do Data Science . Discover the latest news on Google for Developers
- A complete article on the Analytics Engineering Framework
- A guide created by MotherDuck to better understand the different types of logs a data engineer is confronted with.
🤩 Inside Starfox
🐞 Data Bugs
At Starfox, our obsession with Lean is reflected in every detail of our organization. Each bug is not just corrected: it is documented, analyzed and transformed into a source of collective learning. This is the purpose of our bug data log, a structuring tool that centralizes detected anomalies, their business severity, resolution times, root causes and the environments concerned.
This rigorous monitoring enables us to calculate a "power" score for each bug, but above all to capitalize on our errors to accelerate detection, reduce lead time and avoid production incidents.
👉 Of course, it's always better to detect an anomaly during the internal acceptance phase rather than in post-production, when it's reported by the customer.
📍 Example #1 - GA4: Falling user numbers
A default value user_id = "no_value in GTM grouped all non-connected users under a single ID in GA4, resulting in a significant underestimation of unique users.
✅ Immediate removal of fallback + implementation of Trooper (our in-house monitoring tool) to prevent drift on deduplication keys.
⏱️ Detected in production by the customer. Lead time between detection and resolution: 4 hours. Total time between bug occurrence and resolution: 216 hours (9 days).
📍 Example #2 - JS Error loop: Addingwell surcharge
A tag triggered an event in a loop error_eventgenerating 2.7M GA4 hits in just a few hours.
✅ Tag disabled + server-side JS error exclusion.
⏱️ Detected in production by the customer. Lead time between detection and resolution: 2 hours. Total time between bug appearance and resolution: 6 hours.
📍 Example #3 - GA4 vs Looker Studio: Inconsistent metrics
Deviations came from the use of user_id (GA4) vs. user_pseudo_id (BigQuery), creating confusion when counting users.
✅ Query corrected with COALESCE(user_id, user_pseudo_id) + integration into our standard templates.
⏱️ Detected in pre-production by our in-house teams. Lead time between detection and resolution: 3 hours. Total time between bug appearance and resolution: 8 hours.
🙌 Customer feedback
We have chosen to invest in authentic customer testimonials. Convinced that video is a powerful tool for telling stories and creating human links, we decided to focus our communications in this direction, with a clear priority: quality over quantity.
This is the first in a series of four carefully captured testimonials. Each video illustrates not only our results, but also the rich collaborations that make our projects so successful.

A need, a question?
Write to us at hello@starfox-analytics.com.
Our team will get back to you as soon as possible.

.svg)