.svg)


🔥 What's New ?
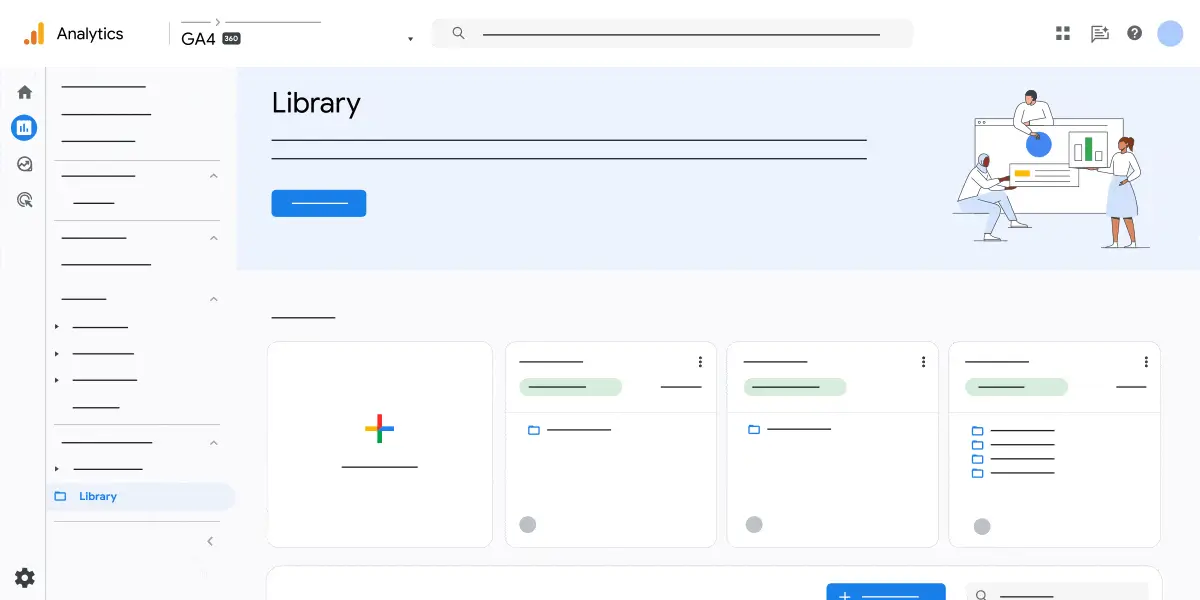
👉 GA4: Copy reports between properties to save time
You can now copy your customized detailed reports from one property to another. No more reconfiguring everything each time. Save time on creation and focus on what matters: analyzing your data and deriving concrete insights.
ℹ️ For more information, visit [GA4] Copy reports and explorations across Google Analytics properties
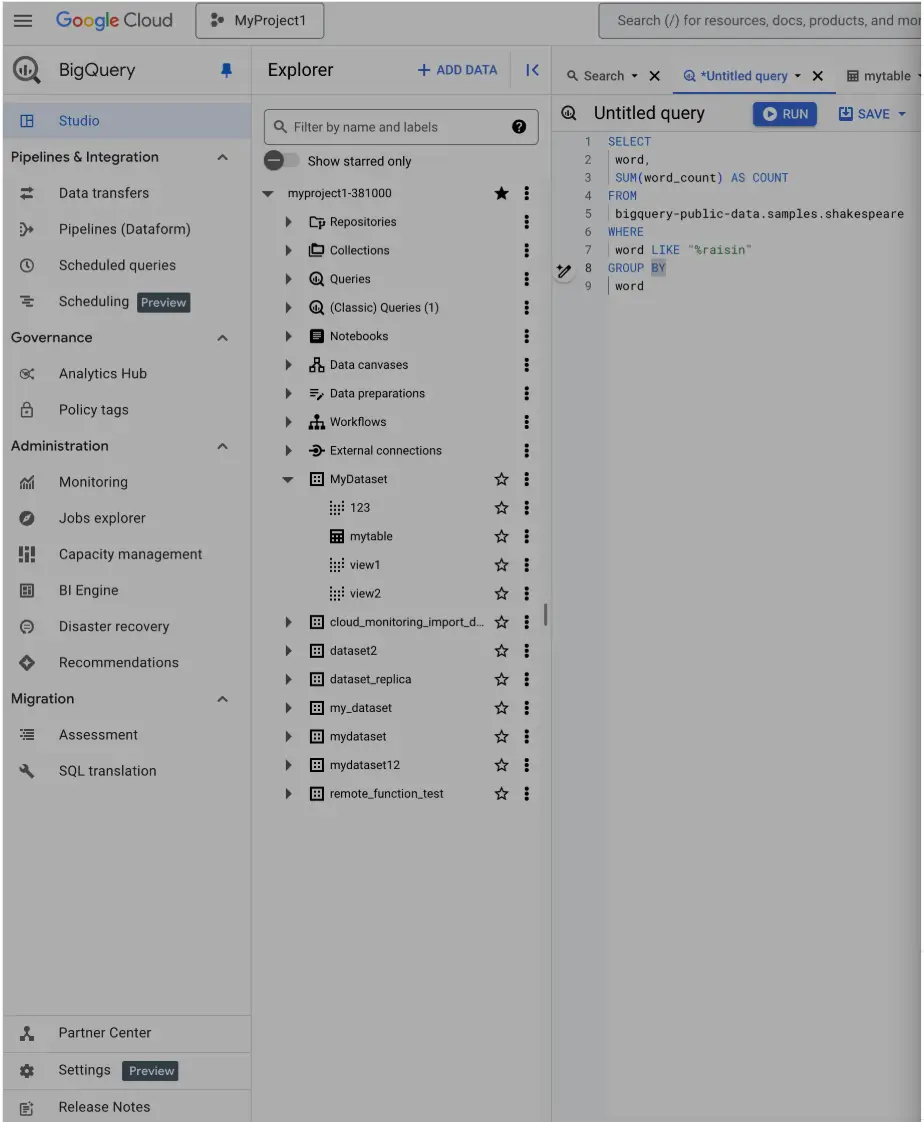
👉 BigQuery is changing the look of its navigation menu:
Google BigQuery has restructured its menu, with the aim of turning BigQuery into an analytics hub instead of a simple datawarehouse:
BigQuery's navigation menu has been restructured into six main categories:
- Studio: Centralizes access to your datasets, tables and query execution, and now integrates Colab Enterprise notebooks.
- Pipelines and integration: Data transfer, Dataform pipelines, programmed queries and a new planning tool (in Preview).
- Governance: Includes Analytics Hub for data exchange and policy tags for classification.
- Administration: Includes monitoring tools, task explorer, capacity management, BI Engine, disaster recovery and recommendations.
- Migration: SQL evaluation and translation tools to facilitate migration from other data warehouses.
- Additional resources: Provides access to the Partner Center, default settings (in Preview) and release notes.
The menu can be minimized to show icons only, or expanded to show full labels.
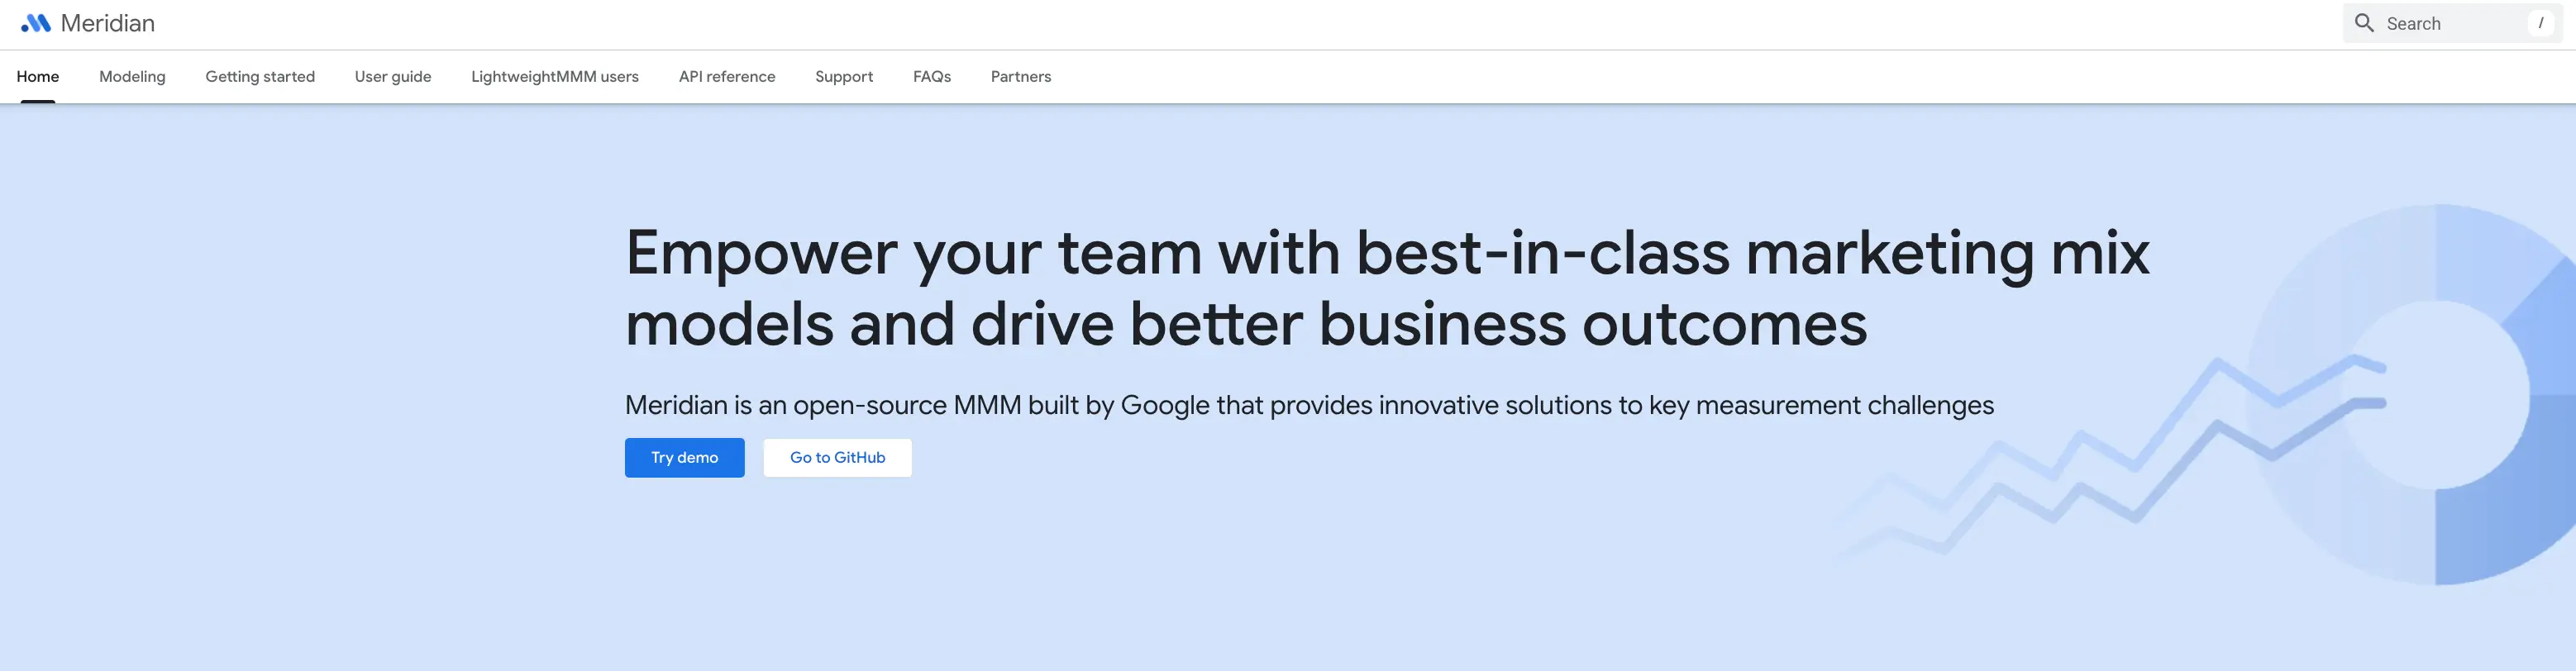
👉 Meridian: Google's new marketing mix analysis tool
Google has launched Meridian, an open-source framework for marketing mix modeling (MMM). This tool helps advertisers measure the impact of their campaigns on revenues and other KPIs.
Meridian works without cookies or personal data, using only aggregated and therefore anonymous data. It relies on Bayesian causal inference to analyze the effectiveness of different marketing channels and take into account external factors that influence performance.
The tool is particularly effective with detailed geographical data, but can also work with national data. It incorporates several technical features such as channel saturation modeling, delayed effects, and the optional use of coverage and frequency data.
Meridian also enables you to optimize budget allocation between different channels and simulate different marketing investment scenarios.
For teams with prior knowledge of their media performance, Meridian's Bayesian approach makes it possible to integrate this information into the model, whether it comes from previous tests, previous MMM results or industry benchmarks.
In concrete terms, Meridian uses statistical models and time series data to help you optimize your advertising mix. Its objective, according to Google, is to maximize return on investment.
👉 Although our team at Starfox Analytics has not yet deployed Meridian in production, we have the technical expertise in Bayesian modeling and causal inference to quickly develop custom POCs. Our consultants are ready to explore how this framework can integrate with your current marketing attribution stack and generate insights into the effectiveness of your channels. Contact us to discuss an implementation tailored to your specific needs.
💡 Tip of the month
Our "Tip of the month" section shares practical tips used daily at Starfox Analytics. These tips cover various Web Analytics tools to optimize your work. Don't hesitate to try them out and share them with your colleagues.
BigQuery :Optimizing queries with temporary tables
BigQuery improves the performance of complex queries by using a combination of temporary tables:
-- Create a temporary table to store an expensive calculation
CREATE TEMP TABLE user_metrics AS
SELECT
 user_id,
  ARRAY_AGG(product_id ORDER BY timestamp DESC)[OFFSET(0)] AS last_viewed_product,
  COUNT(DISTINCT session_id) AS session_count
FROM `dataset.events`
WHERE DATE(_PARTITIONTIME) BETWEEN DATE_SUB(CURRENT_DATE(), INTERVAL 30 DAY) AND CURRENT_DATE()
GROUP BY user_id;

-- Use of the temporary table in the following queries
SELECT
 um.user_id,
  um.last_viewed_product,
  t.conversion_value
FROM user_metrics um
JOIN `dataset.transactions` t USING(user_id)
WHERE um.session_count >  3;
The advantages of this method of creating temporary tables with the CREATE TEMP TABLE are numerous:
- Cost reduction: costly calculations are performed only once, and then reused.
- Improved performance: on large datasets, execution times can be reduced by 40-60%.
- Code simplification: Queries become easier to read by separating processing into logical steps.
- Session durability: Temporary tables persist throughout your BigQuery session, unlike subqueries, which are recalculated on each call.
Typical optimization results :
For a query analyzing 500 million rows with complex aggregations :
- Without temporary table: ~120 seconds, 2.3 TB processed
- With temporary table: ~45 seconds, 1.1 TB processed
The difference is even more marked when intermediate results are used in several successive queries during the same analysis session.
Important limitation: Temporary tables expire at the end of your session. For results that need to persist longer, consider materialized views or standard tables.
📖 Sharing Is Caring
Every month, our "Sharing is Caring" column presents an in-depth article on a current topic in Web Analytics. Our experts use their know-how and online resources to explore these topics in detail.
This month, discover our article written by Fadoua on the Google Natural Language API and how to use it.
❤️ Best resources and articles of the moment
- Discover GA4DATAFORM, a tool that combines GA4 data with BigQuery and Dataform to produce easy-to-use models in just two clicks: GA4Dataform by Superform Labs is now officially Open-Source! 🎉
- A guide to controlling your spending on DBT: Stop Overspending on dbt Tests: Make Costs Visible
🤩 Inside Starfox
I'm continuing this series of news about our inner workings. How we manage our commercial pipeline in Notion ✨
The objective is simple: to win the maximum number of qualified opportunities in the shortest possible time, and to set the missions up for success. Rather than spread ourselves too thinly between different tools, we have structured our entire sales pipeline in Notion, with an automated, ultra-collaborative approach.
🔹 A centralized database: all our opportunities are recorded here, linked to the "Missions", "Partners", "Companies" and "Contacts" databases.
🔹 Intelligent filtered views: dynamic dashboards enable us to immediately identify opportunities to be relaunched as a priority (via criteria such as lead time or lack of recent relaunch).
🔹 Collaborative follow-up: each consultant is responsible for his or her opportunities, with a clear, structured framework.
🔹 Extensive automation: AI helps us qualify deals, fill in opportunity sheets, and even automatically calculate employee bonuses.
🔹 Towards CRM integration: we're going one step further by adding a Pipedrive layer to optimize the tracking of interactions with our customers and partners.
In short, a system designed to minimize friction and maximize conversion. We explain it all in detail here 👇
🙌 Customer feedback
We have chosen to invest in authentic customer testimonials. Convinced that video is a powerful tool for telling stories and creating human links, we decided to focus our communications in this direction, with a clear priority: quality over quantity.
This is the first in a series of four carefully captured testimonials. Each video illustrates not only our results, but also the rich collaborations that make our projects so successful.

A need, a question?
Write to us at hello@starfox-analytics.com.
Our team will get back to you as soon as possible.

.svg)